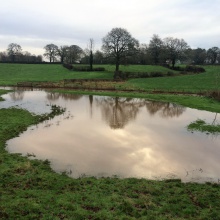
Case study:Rookery Brook Pollution Prevention Project
Project overview
| Status | In progress |
|---|---|
| Project web site | |
| Themes | Environmental flows and water resources, Flood risk management, Habitat and biodiversity, Land use management - agriculture, Monitoring, Water quality |
| Country | England |
| Main contact forename | Nicola |
| Main contact surname | Hall |
| Main contact user ID | User:RADA |
| Contact organisation | |
| Contact organisation web site | http://www.reaseheath.ac.uk/businesses/rada/projects-and-partners/ |
| Partner organisations | |
| Parent multi-site project | |
| This is a parent project encompassing the following projects |
No |
Project summary
The Water Framework Directive (WFD) status of the Rookery Brook has deteriorated from ‘MODERATE’ (2009) to ‘POOR’ (2014). It primarily fails for phosphorus (P) with 88% of this attributed to livestock. Phosphorous is transported to watercourses in solution and also attached to sediment. Pesticides within the watercourse are also elevated, their application and transport pathways will be included within this assessment.
Through better on-farm nutrient management (feeds, fertilisers and manures) the source (P) availability can be reduced and with better water and soil management the pathway from source to receptor can be minimised. The majority of sediment loss from agricultural land occurs during high rainfall events, therefore mitigation measures will be targeted to reduce the impact of such events. Features developed to reduce surface water run-off and/or store water will also reduce the peak flow in the watercourses and therefore the flood risk downstream
There is variable engagement within the farming to these water quality issues and what farmers and land managers can do to improve the situation. Therefore, there needs to be an engagement programme that will enable the mitigations to sustain over time.
The concept of this project has developed from our appreciation that: 1. Current work to engage the farming community with WFD mitigations elsewhere in the region is largely successful, but we do not know the impacts of this work on water quality. There is therefore a need to monitor the development of water quality at the field/farm/sub-catchment scales in order to track the success of mitigations. 2. The majority of sediment is transported following peak events. This is currently not specifically being accounted for in mitigation thinking within our diffuse pollution projects. 3. Near-farm water quality data will be powerful in engaging the farming community further and deeper to own and act upon the catchment action plans to improve water quality within the WFD. 4. Integrating farmer engagement, mitigation advice, peak event thinking and water quality monitoring would provide for more effective and longer lasting impacts as we drive towards WFD targets.
Monitoring surveys and results
Phosphorus
The phosphorus concentrations within Rookery Brook showed a general increase to a peak (around 0.7 mg/l) in late summer (August, September) before reducing to approximately 0.25 mg/l in December and January. A slight worsening in quality is observed between upstream and downstream samples.
Samples from the northern tributaries of the Rookery Brook showed a similar but more pronounced fluctuation. Concentrations rose from between 1.2 to 2 mg/l in July 2015 to 2.2 to 5.2 mg/l at their peaks in September through to November. The southern tributary recorded lower phosphorus concentrations, peaking at 0.7 mg/l in October 2015 (similar to Rookery Brook itself).
In relation to the Water Framework Directive (WFD) monitoring indicated that the Rookery Brook northern tributaries are of ‘poor’ water quality with respect to phosphorus and is itself of ‘moderate’ quality. The southern tributary varied from ‘moderate’ to ‘good’.
Nitrogen
Concentrations of nitrate and other nitrogen compounds, including ammonia, have also been monitored. Ammonia is indicative of sewage effluent, farmyard slurry or manure type of contamination and within the Rookery brook itself varied from 0.2 to 1.5 mg/l classified under the Water Framework Directive as ‘high’ to ‘moderate’ quality. The poorest quality was recorded at the upstream sample point in August. However, peaks also occurred at the mid-catchment sample point in October.
Within the northern tributaries ammonia peaks of between 4 and 20 mg/l were recorded in September and October 2015, which is classified as ‘poor’ quality under the WFD. Again the quality of the southern tributary was better generally being ‘moderate’ to ‘good’.
Nitrate concentrations were generally below the NVZ/Drinking Water Standard threshold of 50 mg NO3/l. However, all the watercourses (Rookery Brook and the northern and southern tributaries) exceeded the threshold in December 2015 to January 2016 with concentrations up to 68 mg NO3/l being recorded.
This data sets out the background or baseline water quality for the lower Rookery Brook catchment prior to the installation of any mitigation measures to improve water quality.
Lessons learnt
1. Monitoring adds high value to prioritisation of interventions and advice
2. Working with landowners to achieve low cost solutions to management of pathways for sediment and nutrient inputs to the watercourse
3. working with partner organization to achieve delivery at low cost and high value
4. SUDS interventions requires detailed planning and communication, close working required to achieve vision and effective outcomes.
Image gallery
|
Catchment and subcatchment
Site
Project background
Cost for project phases
Reasons for river restoration
Measures
MonitoringHydromorphological quality elements
Biological quality elements
Physico-chemical quality elements
Any other monitoring, e.g. social, economic
Monitoring documents
Additional documents and videos
Additional links and references
Supplementary InformationEdit Supplementary Information
| ||||||||||||||||||||||||||||||||||||||||||||||||||||||||||||||||||||||||||||||||||||||||||||||||||||||||||||||||||||||||||||||||||||||||||||||||||||||||||||||||||||||||||||||||||


