Case study:Greater Thames Estuary Fish Migration Roadmap
This case study is pending approval by a RiverWiki administrator.
Project overview
| Status | In progress |
|---|---|
| Project web site | http://fishroadmap.london |
| Themes | Economic aspects, Fisheries, Flood risk management, Habitat and biodiversity, Monitoring, Social benefits, Spatial planning, Urban |
| Country | England |
| Main contact forename | Wanda |
| Main contact surname | Bodnar |
| Main contact user ID | User:WandaBodnar |
| Contact organisation | Thames Estuary Partnership |
| Contact organisation web site | http://thamesestuarypartnership.org/ |
| Partner organisations | |
| This is a parent project encompassing the following projects |
Project summary
Rivers play an important role in our environment: regulating flood risks, transporting sediments and supporting biodiversity. Many of these services are linked to factors that indicate river health such as river flow and connectivity. River network connectivity influences species migration, diversity, and habitat occupancy.
Rivers in the North Sea region are some of the most fragmented by human development in the world due to the presence of artificial structures installed for water management. Man-made water management structures, or barriers, like weirs, sluices and locks can significantly delay and hinder the movement of migratory fish species subsequently reducing their diversity and abundance.
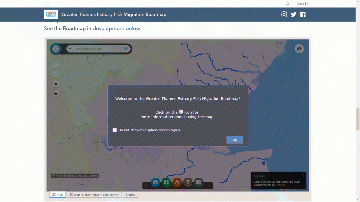
The Greater Thames Estuary Fish Migration Roadmap project seeks to pull together all barrier, pass, habitat, flood risk and development opportunity area data in one place to develop a strategic approach that looks at rivers as migratory routes that fish would use. This ‘whole system’, sea to source approach enables the visualisation of river network connectivity in entire catchments. It is an innovative tool designed to educate and inform decision making when it comes to habitat creation and enhancement, river restoration, riverside development and flood risk assessment.
Monitoring surveys and results
Lessons learnt
Image gallery
|
Catchment and subcatchment
Site
Project background
Cost for project phases
Reasons for river restoration
Measures
MonitoringHydromorphological quality elements
Biological quality elements
Physico-chemical quality elements
Any other monitoring, e.g. social, economic
Monitoring documents
Additional documents and videos
Additional links and references
Supplementary InformationEdit Supplementary Information
| ||||||||||||||||||||||||||||||||||||||||||||||||||||||||||||||||||||||||||||||||||||||||||||||||||||||||||||||||||||||||||||||||||||||||||||||||||||||||||||||||||||||||||||||||||

