Case study:Restoring sea-trout and salmon habitat in Aurlandselva

From RESTORE
Jump to navigation Jump to search
0.00
(0 votes)


To discuss or comment on this case study, please use the discussion page.


Location: 60° 54' 29.29" N, 7° 11' 23.18" E
Loading map...
Left click to look around in the map, and use the wheel of your mouse to zoom in and out.


Project overview

Edit project overview
Status In progress
Project web site
Themes Environmental flows and water resources, Fisheries, Hydropower, Hydromorphology, Monitoring
Country Norway
Main contact forename Bjørn Otto
Main contact surname Dønnum
Main contact user ID User:Bod
Contact organisation E-CO Energy
Contact organisation web site http://www.e-co.no
Partner organisations E-CO Energy, UNI Research, NINA
This is a parent project
encompassing the following
projects
File:Aurlandselva
Project picture

Project summary

Edit project overview to modify the project summary.


In 1997, 11 weirs have been removed.

In 2003-2009, side channels have been opened.

In 2010, a fishway has been opened.

In 2009-2012, spawning gravel has been introduced.

In 2010-2011, Harrowing has been applied.

Monitoring surveys and results

Edit project overview to modify the Monitoring survey and results.


E-CO have continuos data from detailed monitoring reaching back to 1988 on fish population (salmon and sea trout). We also have data on the invertebrate community in the river from before the hydro-power development started. There are also physio-chemical data, and continous data on discharge and water temperature. There are also data on the efficiency of the fishway, both for fish migrating up and downstream.

The data will be published in a small summary report at a later stage.

Lessons learnt

Edit project overview to modify the lessons learnt.


What we have learned so far is the importance of having reliable discharge data, and also the need to target monitoring to measure any specific restoration work being carried out.


Image gallery


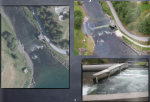
Gravel cover applied in the river (Check link below in "additional links and references" for source).
Fishpass that was created in the river (Check link below in "additional links and references" for source).
Side channels that were connected to the river (Check link below in "additional links and references" for source).
ShowHideAdditionalImage.png


Catchment and subcatchment


Site

Name
WFD water body codes
WFD (national) typology
WFD water body name
Pre-project morphology
Reference morphology
Desired post project morphology
Heavily modified water body
National/international site designation
Local/regional site designations
Protected species present
Invasive species present
Species of interest
Dominant hydrology
Dominant substrate
River corridor land use
Average bankfull channel width category
Average bankfull channel width (m)
Average bankfull channel depth category
Average bankfull channel depth (m)
Mean discharge category
Mean annual discharge (m3/s)
Average channel gradient category
Average channel gradient
Average unit stream power (W/m2)


Project background

Reach length directly affected (m)
Project started 1997/01/01
Works started
Works completed
Project completed 2012/12/31
Total cost category
Total cost (k€)
Benefit to cost ratio
Funding sources

Cost for project phases

Phase cost category cost exact (k€) Lead organisation Contact forename Contact surname
Investigation and design
Stakeholder engagement and communication
Works and works supervision
Post-project management and maintenance
Monitoring


Reasons for river restoration

Mitigation of a pressure Hydropower
Hydromorphology Continuity for organisms, Continuity of sediment transport
Biology
Physico-chemical
Other reasons for the project


Measures

Structural measures
Bank/bed modifications Weir removal, Reopening of side channels, Creation of fish passes, Introduction of spawning gravels
Floodplain / River corridor
Planform / Channel pattern
Other
Non-structural measures
Management interventions
Social measures (incl. engagement)
Other


Monitoring

Hydromorphological quality elements

Element When monitored Type of monitoring Control site used Result
Before measures After measures Qualitative Quantitative

Biological quality elements

Element When monitored Type of monitoring Control site used Result
Before measures After measures Qualitative Quantitative

Physico-chemical quality elements

Element When monitored Type of monitoring Control site used Result
Before measures After measures Qualitative Quantitative

Any other monitoring, e.g. social, economic

Element When monitored Type of monitoring Control site used Result
Before measures After measures Qualitative Quantitative


Monitoring documents


Additional documents and videos


Additional links and references

Link Description
http://www.yumpu.com/en/document/view/25721128/a-tool-for-solving-res-and-wfd-incompatibilities-bjrn-otto-dnnum-/5 RR a tool for solving RES and WFD incompatabilities

Supplementary Information

Edit Supplementary Information