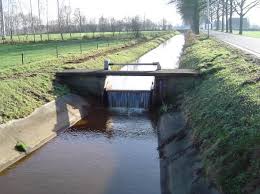
Case study:Beekherstel Leerinkbeek

From RESTORE
Jump to navigation Jump to search
0.00
(0 votes)


To discuss or comment on this case study, please use the discussion page.


Location: 52° 4' 51.16" N, 6° 34' 52.99" E
Loading map...
Left click to look around in the map, and use the wheel of your mouse to zoom in and out.


Project overview

Edit project overview
Status Complete
Project web site
Themes Flood risk management, Habitat and biodiversity, Monitoring
Country Netherlands
Main contact forename John
Main contact surname Lenssen
Main contact user ID
Contact organisation Waterschap Rijn en Ijssel
Contact organisation web site http://www.wrij.nl/
Partner organisations STOWA
Parent multi-site project

Building with Nature measures in streams

This is a parent project
encompassing the following
projects
No
Leerinkbeek

Project summary

Edit project overview to modify the project summary.


The Leerinkbeek water body is classified as a river under the WFD system. It is an R5 category water body: slow-flowing middle/lower reach on sand. The entire Leerinkbeek is managed by water authority Rijn en IJssel. The water body is located in the province of Gelderland, municipality Berkelland. It is 8,4 km long and has a catchment of 4051 hectares. The water body consists of a single channel. The water body originates in the Hupselse Beek, near the loam pits at Zwilbrock. The Leerinkbeek discharges into the Berkel. Water levels in the Leerinkbeek are managed with six adjustable weirs. None of these weirs are passable for fish. In the Leerinkbeek water body, a single maximum water level is pursued for each managed stretch, for which the weirs are used. In dry periods, the 44 upstream stretches of the water body run dry. There are no sewage treatment plants present in the catchment of the Leerinkbeek.

Five bundles were introduced over the full width of the stream. This was mainly done as an experiment with the introduction of dead wood in streams.

Monitoring surveys and results

Edit project overview to modify the Monitoring survey and results.


The bundles of branches got clogged and started to cause backwater effects. Therefore, they were replaced with coarser material, which did not cover the full width of the stream. This had a positive effect on macroinvertebrates and created more variation in structure.

Lessons learnt

This case study hasn’t got any lessons learnt, you can add some by editing the project overview.


Image gallery


ShowHideAdditionalImage.png


Catchment and subcatchment

Catchment

River basin district Rijn
River basin Rijndelta

Subcatchment

River name Berkel
Area category 100 - 1000 km²
Area (km2)
Maximum altitude category Less than 100 m
Maximum altitude (m) 2323 m <br />0.023 km <br />2,300 cm <br />
Dominant geology Siliceous
Ecoregion Central Plains
Dominant land cover Grassland, Intensive agriculture (arable), Broadleaf/mixed woodland (semi natural)
Waterbody ID NL07_0016


Other case studies in this subcatchment: Beekherstel Eefsebeek, Beekherstel Ramsbeek, Beekherstel Willinkbeek, Beneden-Berkel, Boldersbeek


Site

Name Leerinkbeek
WFD water body codes NL07_0019
WFD (national) typology R5
WFD water body name
Pre-project morphology Sterk veranderend
Reference morphology Actively meandering
Desired post project morphology
Heavily modified water body No
National/international site designation
Local/regional site designations
Protected species present No
Invasive species present No
Species of interest
Dominant hydrology Artificially regulated
Dominant substrate Sand, Keileem en Dekzand
River corridor land use Grassland
Average bankfull channel width category 2 - 5 m
Average bankfull channel width (m) 22 m <br />0.002 km <br />200 cm <br />
Average bankfull channel depth category 0.5 - 2 m
Average bankfull channel depth (m) 0.50.5 m <br />5.0e-4 km <br />50 cm <br />
Mean discharge category 1 - 10 m³/s
Mean annual discharge (m3/s) 3.73.7 m³/s <br />3,700 l/s <br />
Average channel gradient category 0.001 - 0.01
Average channel gradient 0.0016
Average unit stream power (W/m2) 29.0287229.029 W/m² <br />


Project background

Reach length directly affected (m)
Project started 2007/2015"2007/2015" contains a sequence that could not be interpreted against an available match matrix for date components.
Works started
Works completed 2015/12/31
Project completed
Total cost category
Total cost (k€)
Benefit to cost ratio
Funding sources

Cost for project phases

Phase cost category cost exact (k€) Lead organisation Contact forename Contact surname
Investigation and design
Stakeholder engagement and communication
Works and works supervision
Post-project management and maintenance
Monitoring


Reasons for river restoration

Mitigation of a pressure
Hydromorphology Channel pattern/planform, Continuity for organisms, Flow velocities
Biology Fish, Invertebrates
Physico-chemical PH, Oxygen balance, Nutrient concentrations, Temperature
Other reasons for the project


Measures

Structural measures
Bank/bed modifications Beschaduwing
Floodplain / River corridor Dood hout inbreng
Planform / Channel pattern
Other
Non-structural measures
Management interventions
Social measures (incl. engagement)
Other


Monitoring

Hydromorphological quality elements

Element When monitored Type of monitoring Control site used Result
Before measures After measures Qualitative Quantitative
Width & depth variation Yes Yes No No No Improvement
Flow velocities Yes Yes No No No Improvement
Substrate conditions Yes Yes No No No Improvement

Biological quality elements

Element When monitored Type of monitoring Control site used Result
Before measures After measures Qualitative Quantitative
Fish Yes Yes No No No Improvement
Invertebrates Yes Yes No No No Improvement

Physico-chemical quality elements

Element When monitored Type of monitoring Control site used Result
Before measures After measures Qualitative Quantitative
Oxygen balance Yes Yes No No No Improvement
PH Yes Yes No No No Improvement
Temperature Yes Yes No No No Improvement
Nutrient concentrations Yes Yes Yes No No Improvement

Any other monitoring, e.g. social, economic

Element When monitored Type of monitoring Control site used Result
Before measures After measures Qualitative Quantitative
Concentration phosphate, Chloride and Nitrogen Yes Yes Yes No No Improvement


Monitoring documents


Additional documents and videos


Additional links and references

Link Description

Supplementary Information

Edit Supplementary Information